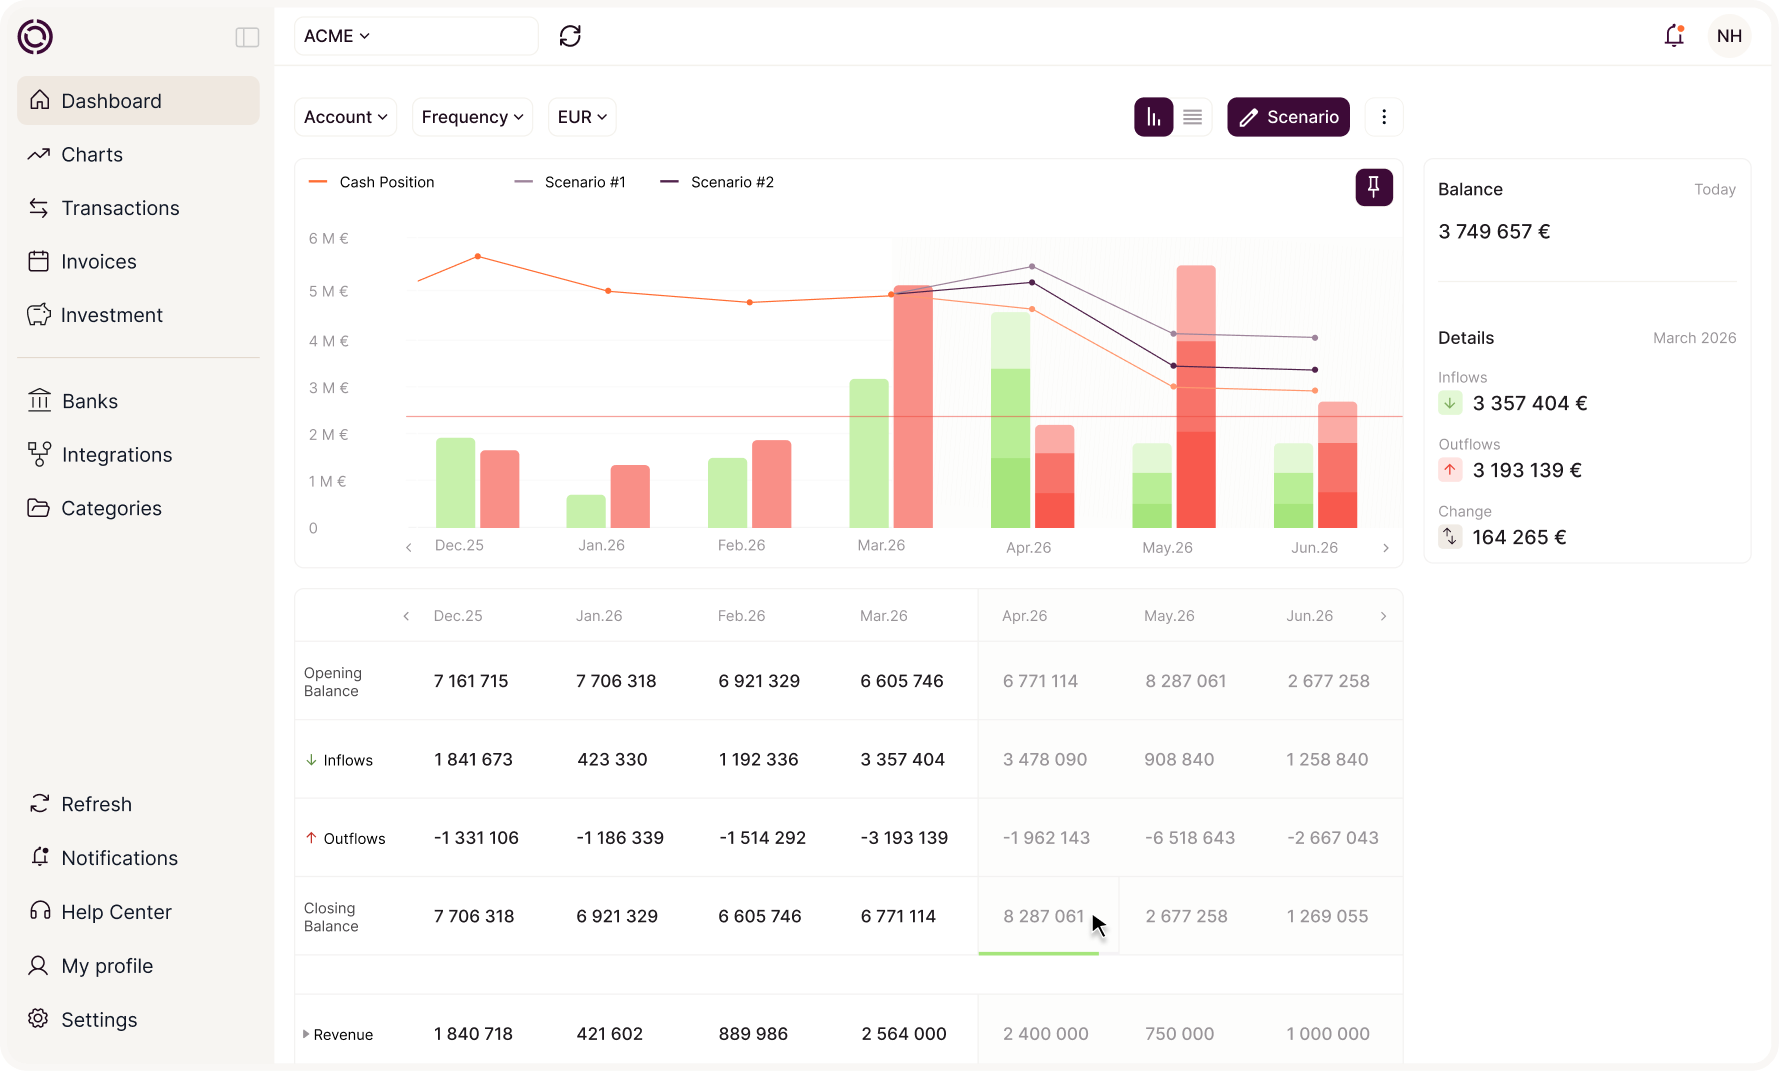
Your cash data finally speaks for itself


4.9/5
Spending hours reformatting your exports just to produce a readable cash report? Okimia turns your monitoring data into charts, metrics and share-ready exports.











From the reworked spreadsheet to a report that's always ready
Every month, it's the same ritual: export, reformat, rebuild the charts, adjust the formulas. With Okimia, the report updates continuously. You no longer produce it — you simply consult it.
Analyze, measure, share.
From a single interface
Okimia's reporting covers the three things a CFO does when reporting on cash: visualize how flows break down, track key metrics, and export the data to use elsewhere.
See where your cash goes, period by period
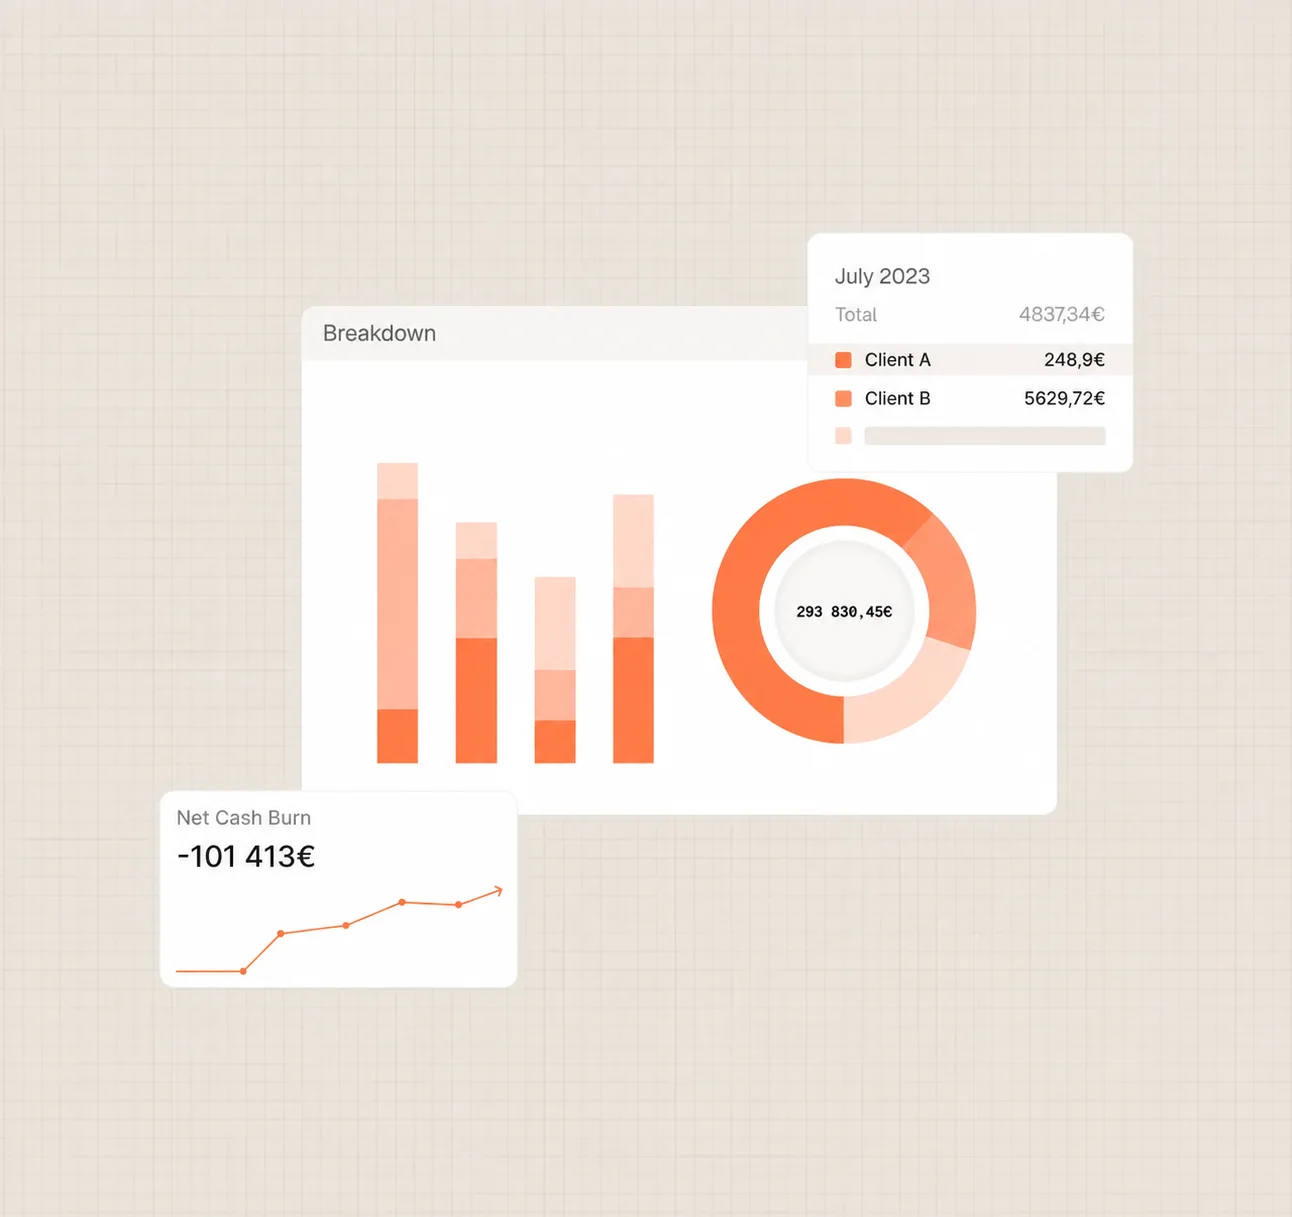
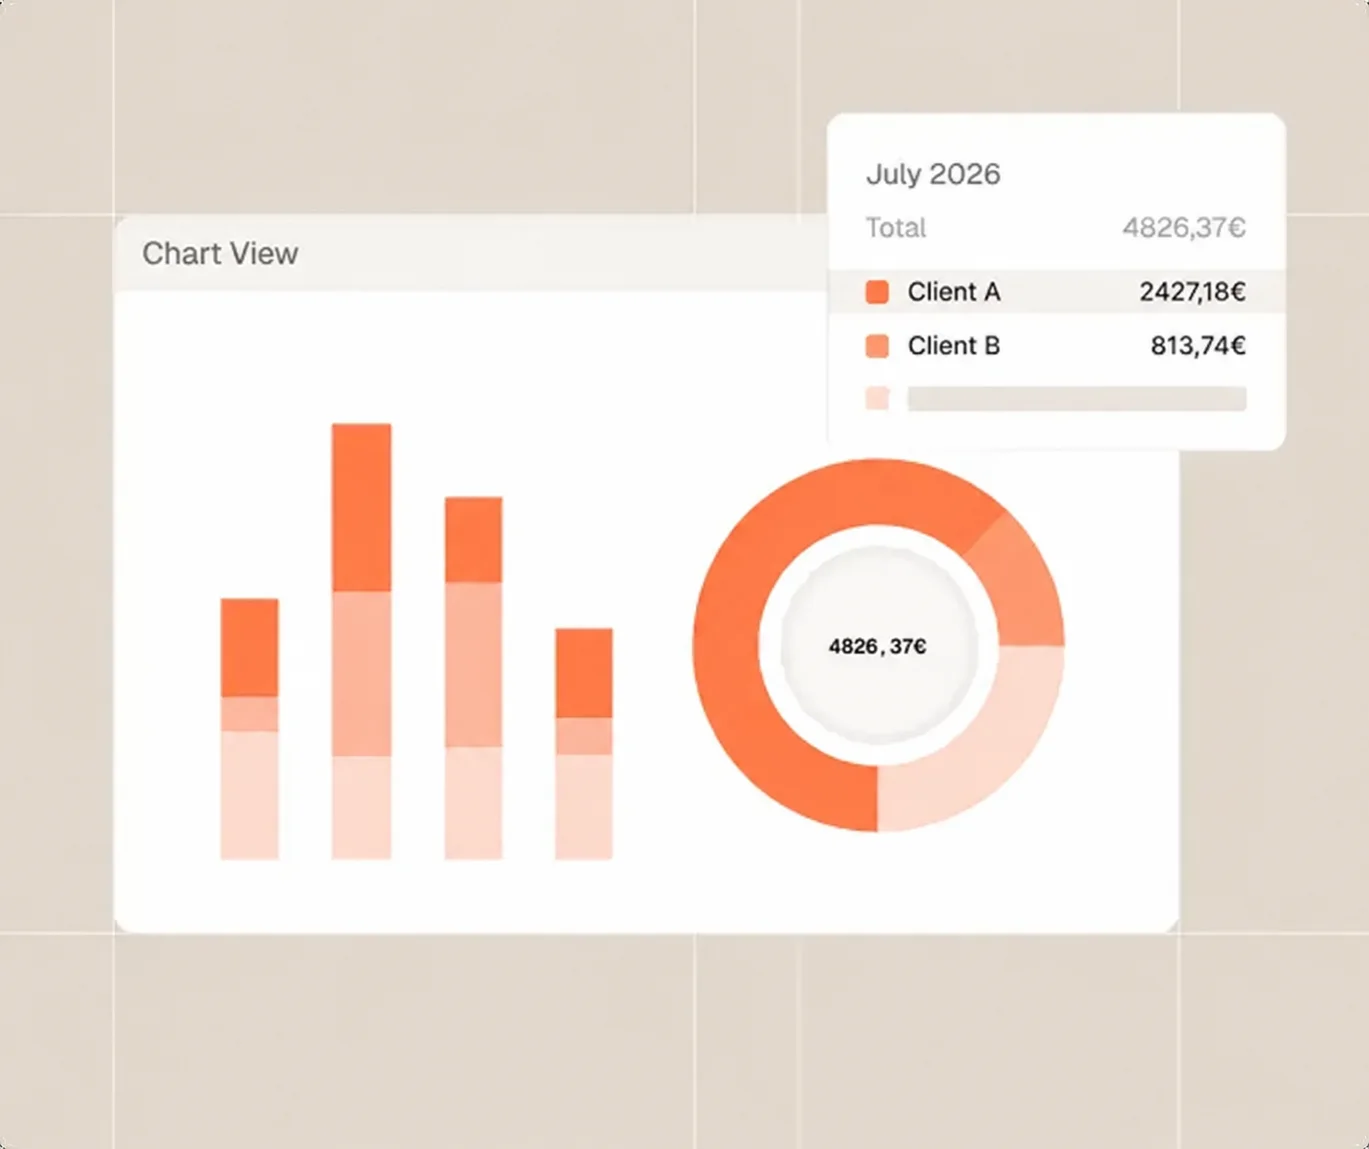
Breakdown charts split your inflows and outflows by category, over the date range of your choice. You filter by category, adjust the period, and compare two ranges side by side to spot the variations.
No more building a chart in Excel just to understand why your cash moved this quarter: the answer is visual and immediate.
Build a dashboard with your key metrics
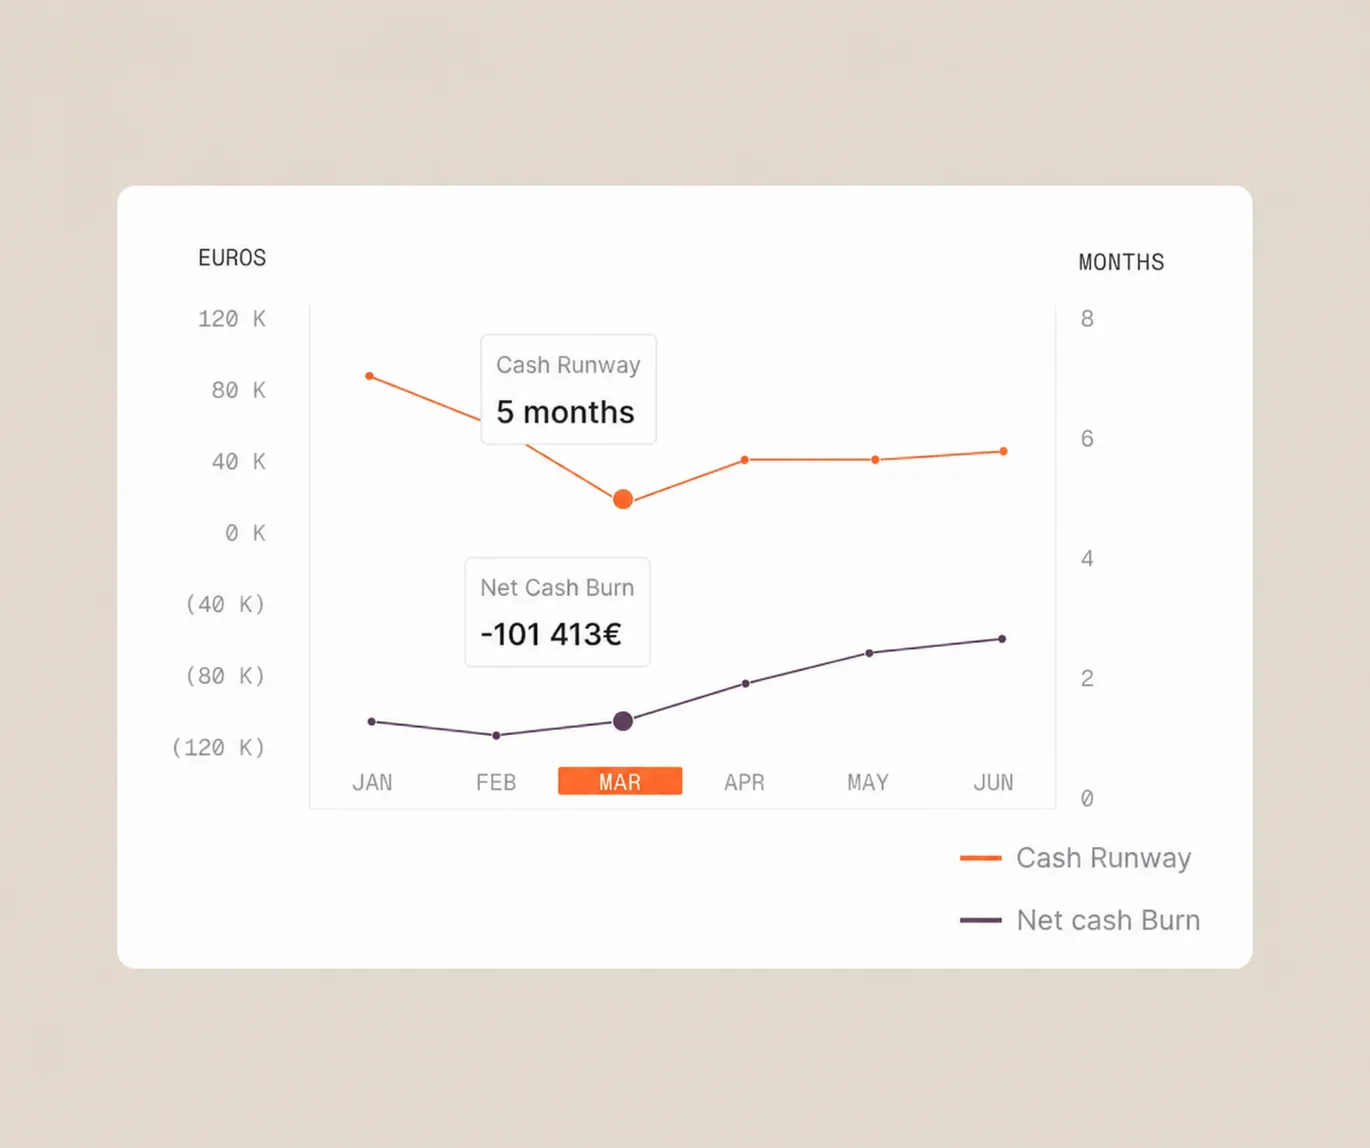
Create your own metrics from all the data stored in Okimia: balance, burn rate, runway, change over a period.
You define what you measure, set alert thresholds, and get a dashboard aligned with what your stakeholders ask for. The metrics update automatically and in real time.
Export the data to run your own analyses
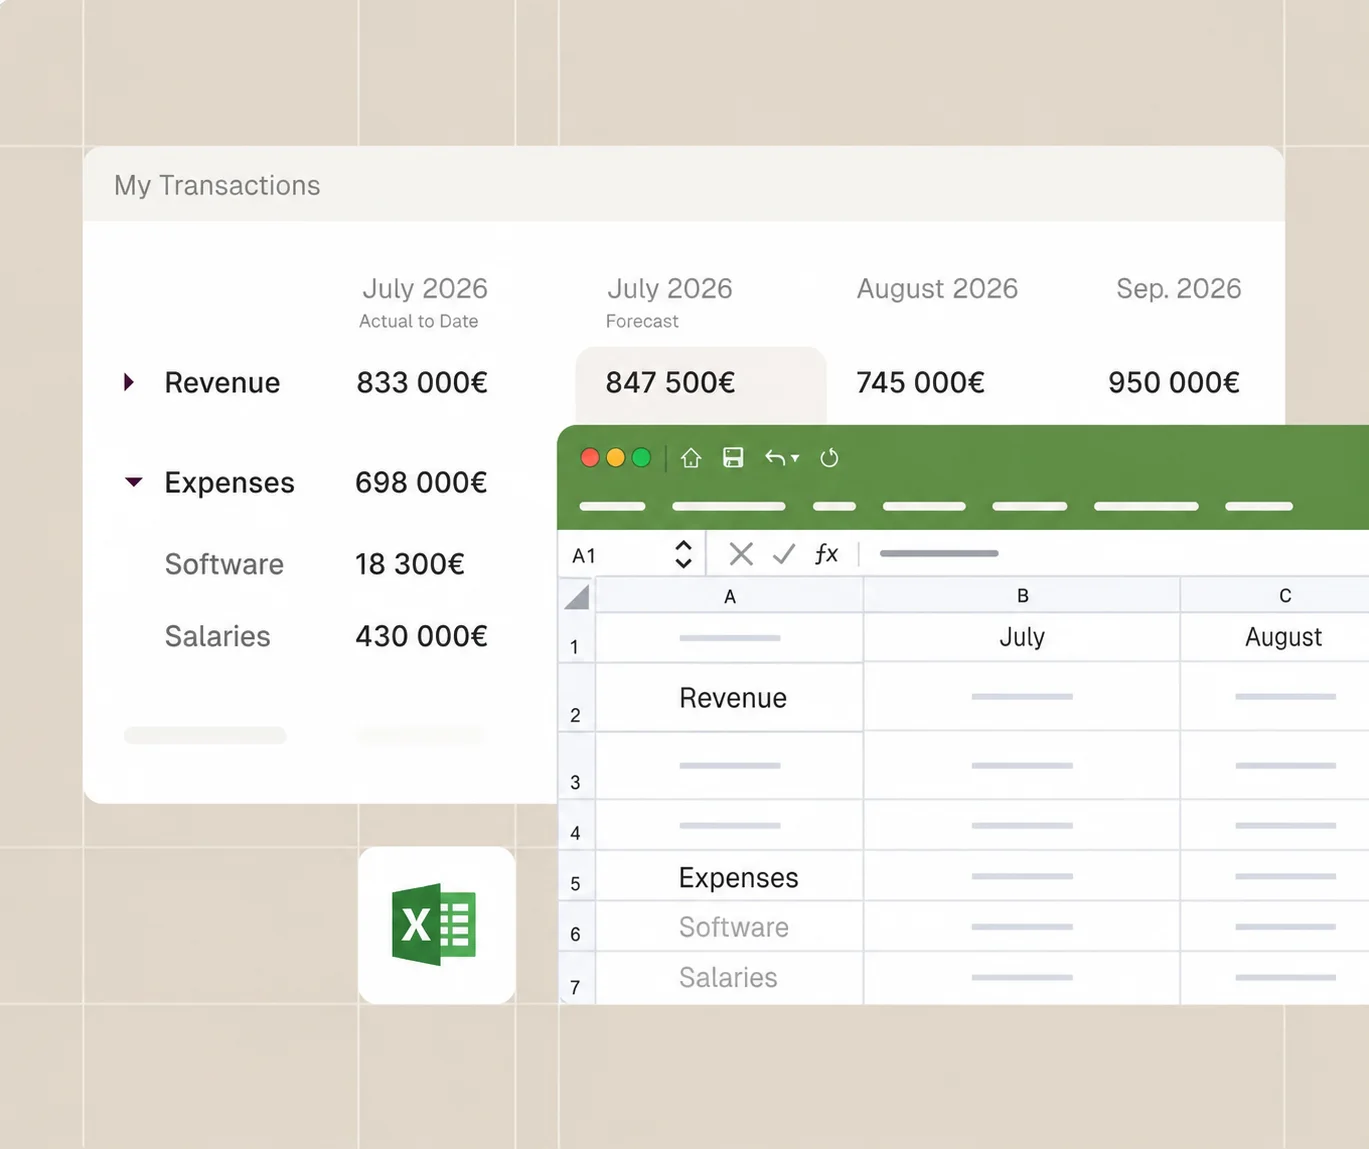
The spreadsheet export gives you access to your structured, up-to-date data, ready to plug into your Excel models or your internal reports. You retrieve reliable data without re-entering it, and you rework it freely: your own charts, your own cross-tabs, your own formats.
Okimia data isn't locked inside the tool — it feeds the rest of your finance workflow.


100% GDPR compliant
Your data is hosted in Europe, with AWS in Frankfurt. Our processes are fully GDPR compliant.

Trusted partners
Whether for aggregating your banking data, executing your payments or investing your cash, our partners are carefully vetted.

Registered with ORIAS
Okimia is registered as a COBSP (Banking Operations and Payment Services Broker) and a CIF (Financial Investment Advisor).
They replaced their spreadsheet and they're not going back.


.webp)


We're here to help

Have more questions?
Don't hesitate to contact our teams.
What is effective cash reporting and why does Okimia simplify it?
Effective cash reporting must answer three questions: where is my cash, how has it evolved, and what is going to happen? Today, producing this report often takes several hours: bank exports, reformatting, chart reconstruction. With Okimia, cash reporting updates continuously from your real data. You no longer produce it — you consult it. Charts, indicators, and exports are available at any time, without any manipulation.
What indicators can be configured in Okimia's cash reporting?
Okimia lets you create your own cash reporting indicators from all your financial data: balance by entity, burn rate, cash runway, period-on-period variation, DSO, DPO. You set alert thresholds and get a dashboard calibrated to what your stakeholders — management, shareholders, bankers — ask you for. Indicators refresh automatically, without you having to recalculate them.
Can you share cash reporting with external stakeholders?
Yes. You grant read access to your internal or external stakeholders — general management, shareholders, advisors — with the rights you define. They access a visual, structured cash report directly, without you needing to prepare a file or contextualise the data. If you prefer to export, a structured Excel export is available at any time to feed your own financial models.
Does Okimia's cash reporting really replace the Excel dashboard?
For the vast majority of SME finance teams, yes. Okimia reporting covers concrete needs: flow breakdown by category, bank balance tracking, evolution charts, customised indicators, spreadsheet export. The fundamental difference from Excel: data is always up to date, the structure never breaks, and you don't have to rebuild the report each month. You save time on production to invest more in analysis.
Request a demo
30 minutes with a specialist who will set up Okimia for your business. They will answer all your questions and show you the product in real-world conditions.
Free trial
Create your account and connect your banks in 5 minutes. 7 days free to explore Okimia at your own pace, no commitment.